Issue #3 - Exemplifying Multiple Linear Regression
With the bites o SQL's execution order, Python Structure and The Pop-Out effect applied to DataViz.
Hey everyone! This is Josep, one more week 👋🏻
Today we have a new issue plenty of stuff 💥
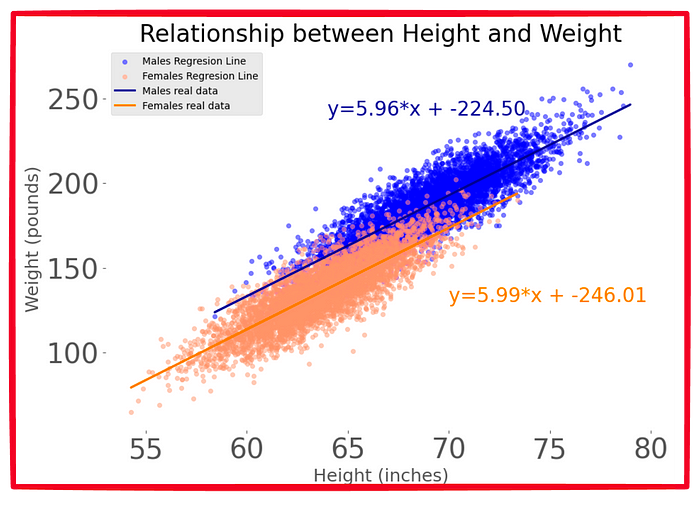
Exemplifying Multiple Linear Regression with a real-world example.
In the bustling world of Data Science, multiple variable linear regression is like a maestro orchestrating a symphony of data points!
Imagine you're a detective, sifting through clues (variables) like height to solve a mystery: predicting a person's weight.
With each clue having its own weight (coefficient), our maestro, the regression model, conducts the data to play a tune that reveals hidden patterns.
Simple linear regression is the most basic ML algorithm. It’s where most of us start our journey into data modeling.
However… what happens when there are multiple variables to consider?
Multiple linear regression introduces new members to the formula, extending our model across multiple variables.
The core theory is the same: We still use a linear function to predict our target.
But we can track N independent values.
We can use scikit-learn to implement such MLR. The code is quite straightforward and we can easily obtain all three weights.
You can check how to implement this in the following article.
Do you prefer getting one of my cheatsheets? Here you have it!
🧩 Weekly Bites
#1. Understanding SQL’s Execution Order
Ever felt confused by SQL's execution flow? Then… you are not the only one!
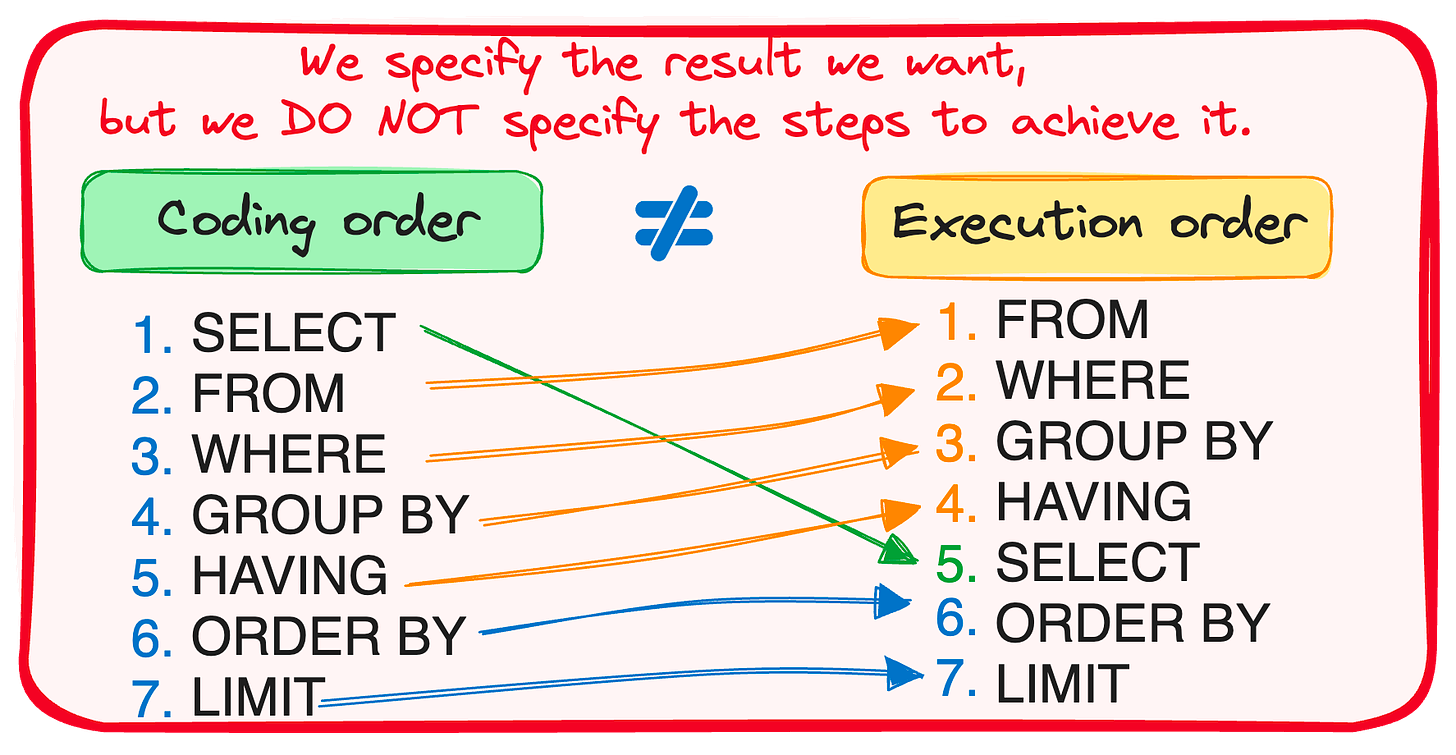
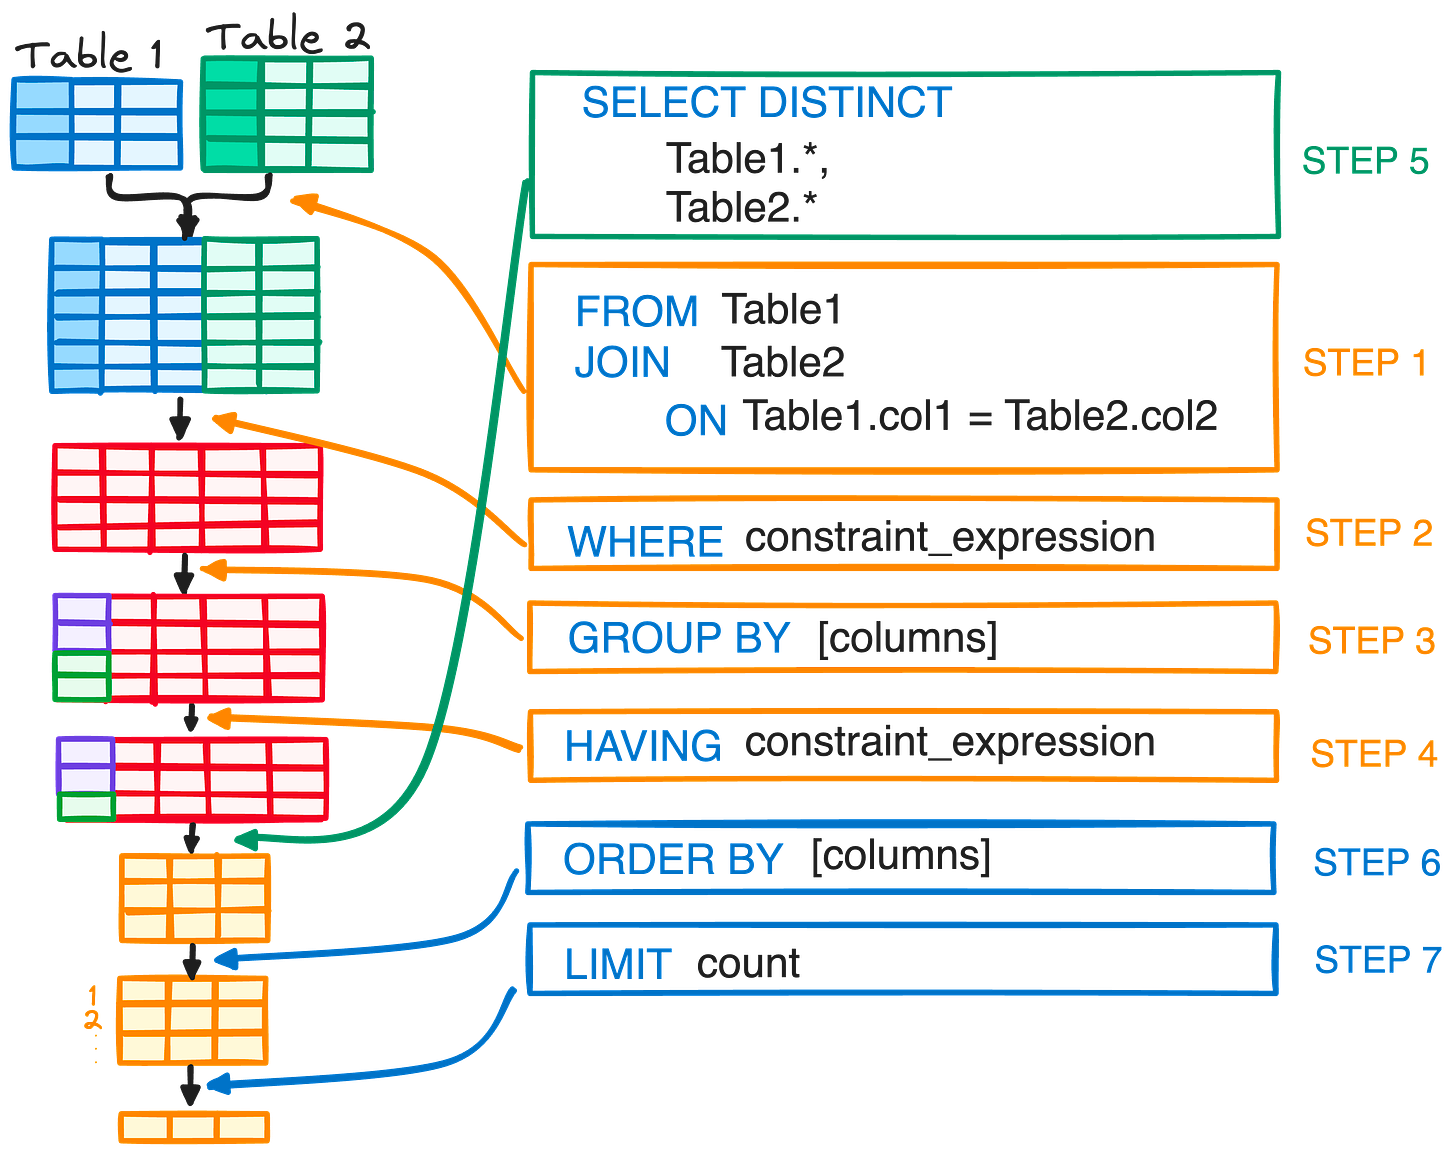
SQL is a declarative language, which means that you tell it what you want, not how to do it. To put it simple, SQL expects statements to be written in a specific order ... but their evaluation sequence differs.
So, if we try to understand SQL’s query execution order visually, it would be something like follows:
You can further understand SQL’s execution order in the following article.
If you prefer a cheatsheet, just go get it!
#2. Python’s simple structure
Python's simplicity is almost poetic, so today let’s dive into two elegant Python’s features.
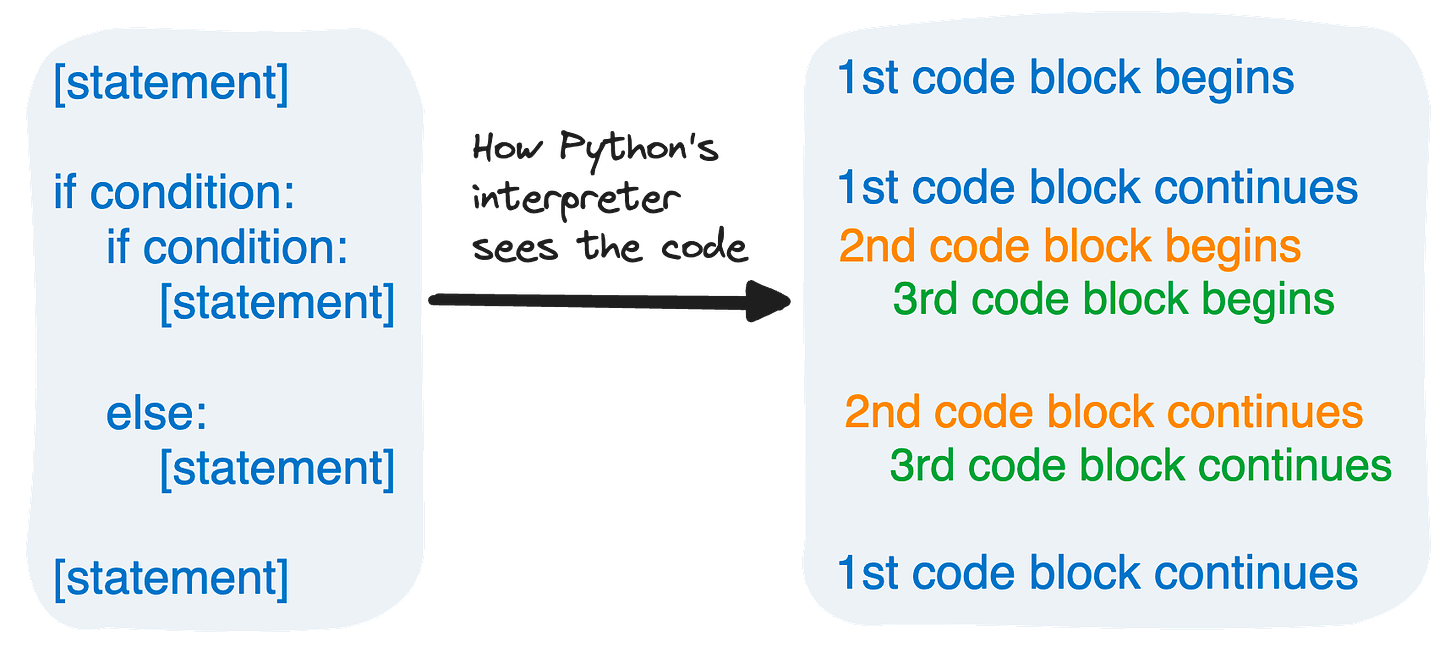
The art of whitespaces
Python's beauty lies in its simplicity. Unlike other languages cluttered with braces and keywords, Python uses plain old indentation to define a program's structure. It's like poetry for coders!
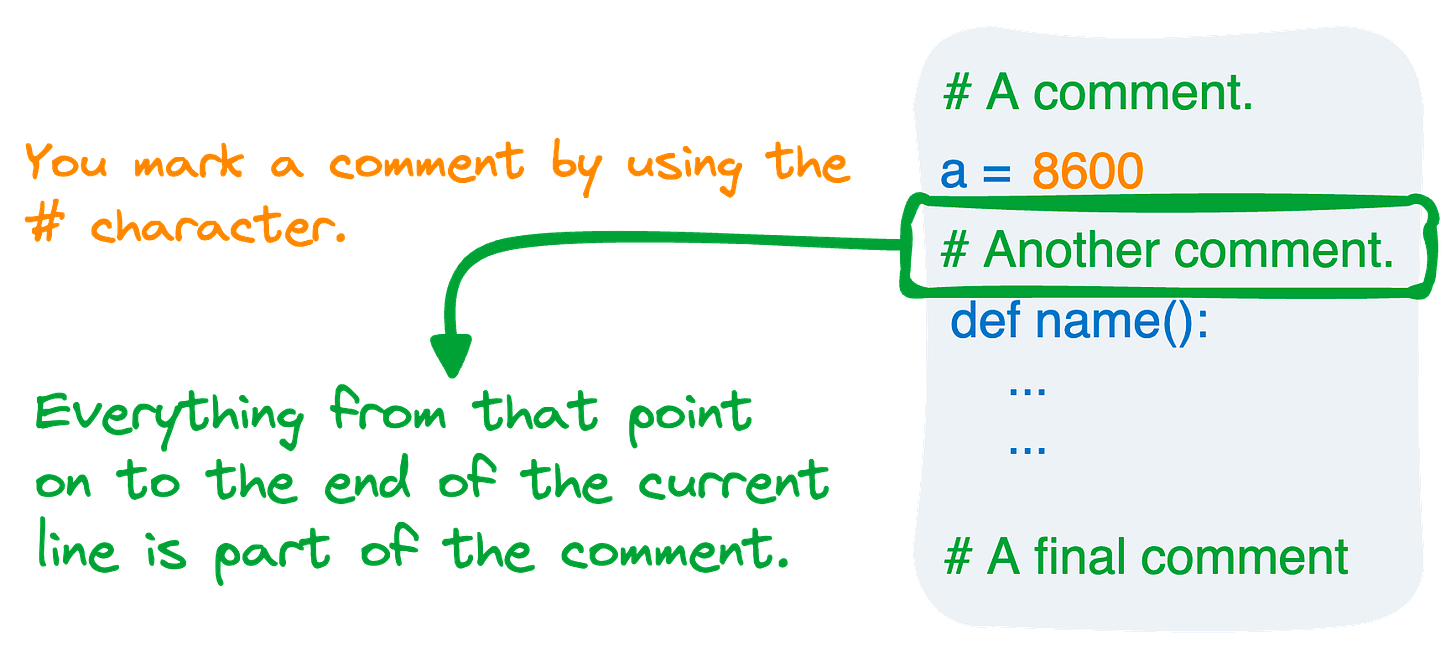
Comments with #
Comments in Python? Just a hashtag away! # marks your thoughts that the Python interpreter skips. It's like whispering secrets to your future self.
⚠️ Remember, though, Python prefers brief notes – multiline comments need a # on each line.
#3. The Art of Data Visualization: Pop-out Effect
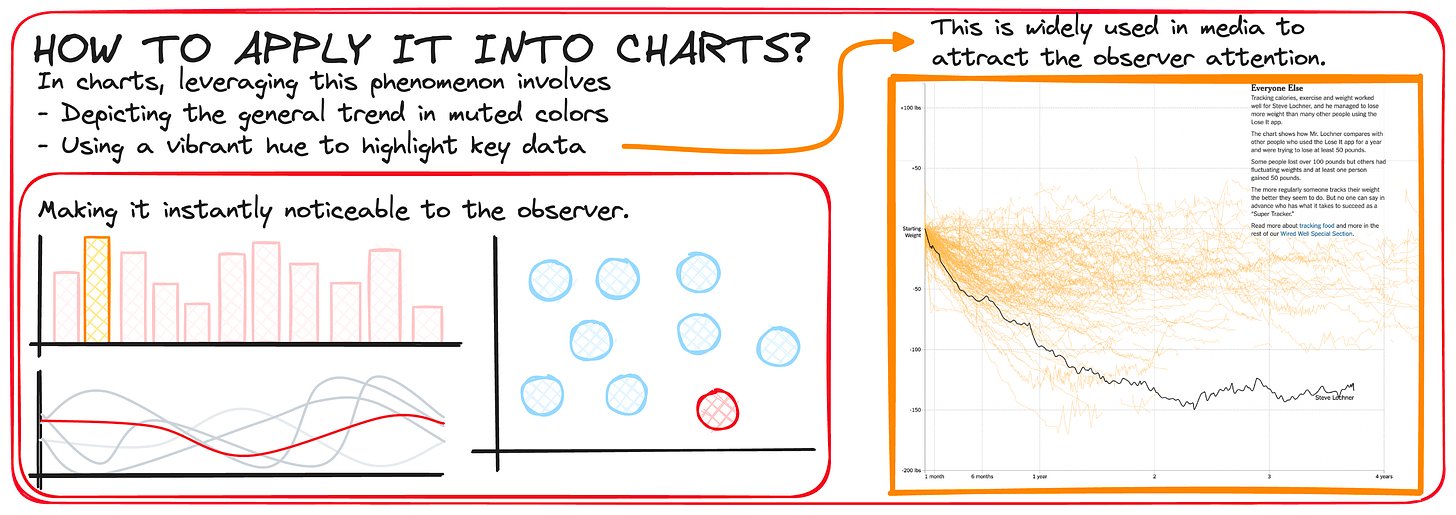
Imagine you're at a bustling party and your friend's bright red hat catches your eye from across the room - that's the pop-out effect!
But wait… how does this apply to Data Visualization?
Our brain automatically catches elements that present specific characteristics when compared to their surroundings. When charts are a jungle of information, the pop-out effect is your trusty guide, shining a spotlight on the data that matters most.
By painting the key data in bold colors against a canvas of muted tones, your chart communicates more effectively the message you want to tell to your observer.
Cutting through the noise and hitting the high notes of insight!
So next time you craft a chart, remember, you're not just a data professional.... You're a storyteller! 🤓
And this is all for now!
If you have any suggestions or preferences, please comment below or message me through my social media!
Remember you can also find me in X, Threads, Medium and LinkedIn 🤓







Great issue! You covered very important concepts!