Issue #1 - A Fresh Start with DataBites
Where Data Science lessons come alive in weekly insightful bites 🤓
Welcome on board everyone!
Today we have a fresh start with a brand-new newsletter.
In this issue, I am starting 4 new sections:
A concise ML lesson with MLBasics.
Three short and synthesized Bites about SQL, Python, and DataViz.
So… let’s start! 👇🏻
In the world of data and computer programs, the concept of Machine Learning might sound like a tough nut to crack, full of tricky math and complex ideas 😓
This is why today I want to slow down and check out the basic stuff that makes all this work.
I’m kicking off a fresh set of articles I’m calling MLBasics
We’re going to revisit the simple, yet super-important, models that are the ABCs of ML.
Think of it as starting with the easy pieces of a big puzzle.
We’re going back to the simple stuff, where it’s easy to get what’s going on.
Linear Regression
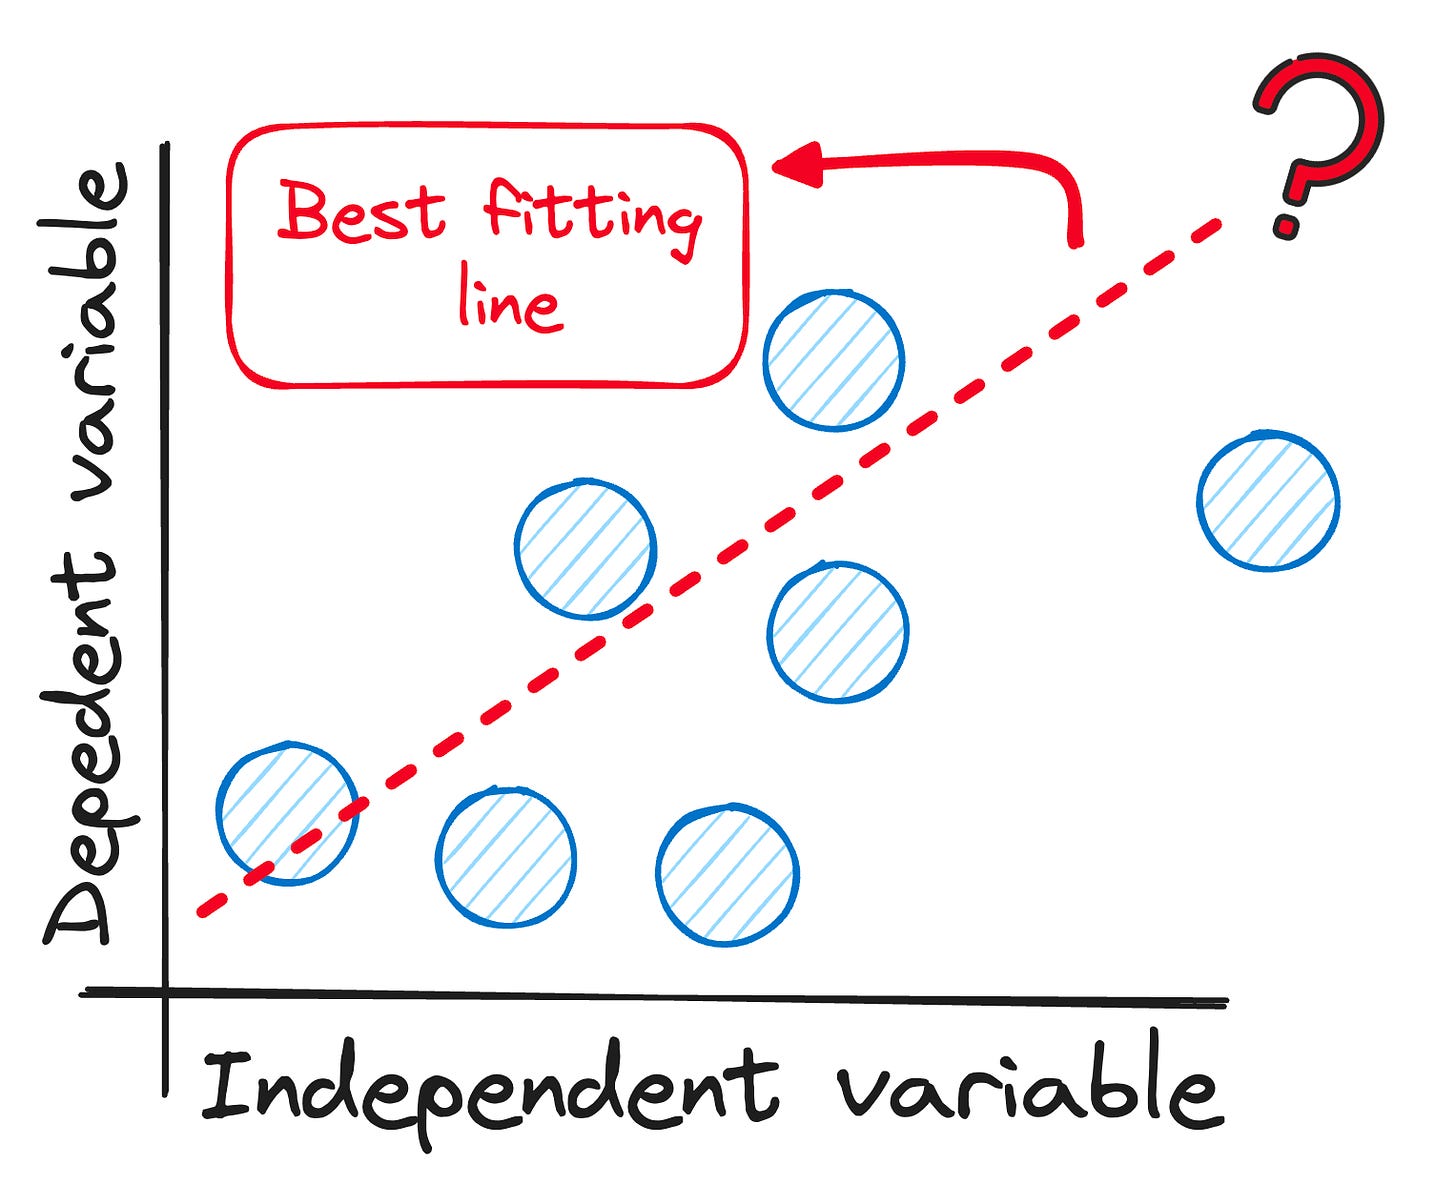
The realm of predictive analysis is vast, yet at its heart lies Linear Regression — the simplest method to make sense of data trends.
🎯 The main goal?
Find a linear relationship between:
The independent variable or predictor.
The dependent variable or output
In plain talk, Linear Regression is all about finding a straight line that shows how two things are connected, like…
How much you study (that’s the independent bit).
What are your test scores (that’s the dependent bit).
The big idea is to see how one thing can predict the other.
Sounds interesting, right?
You can find the whole theory in the following link and you can find the Linear Regression cheat sheet in the following post.
🧩 Weekly Bites
#1. Reusable and Understandable SQL queries
Ever wondered how to define Reusable and Understandable SQL queries?
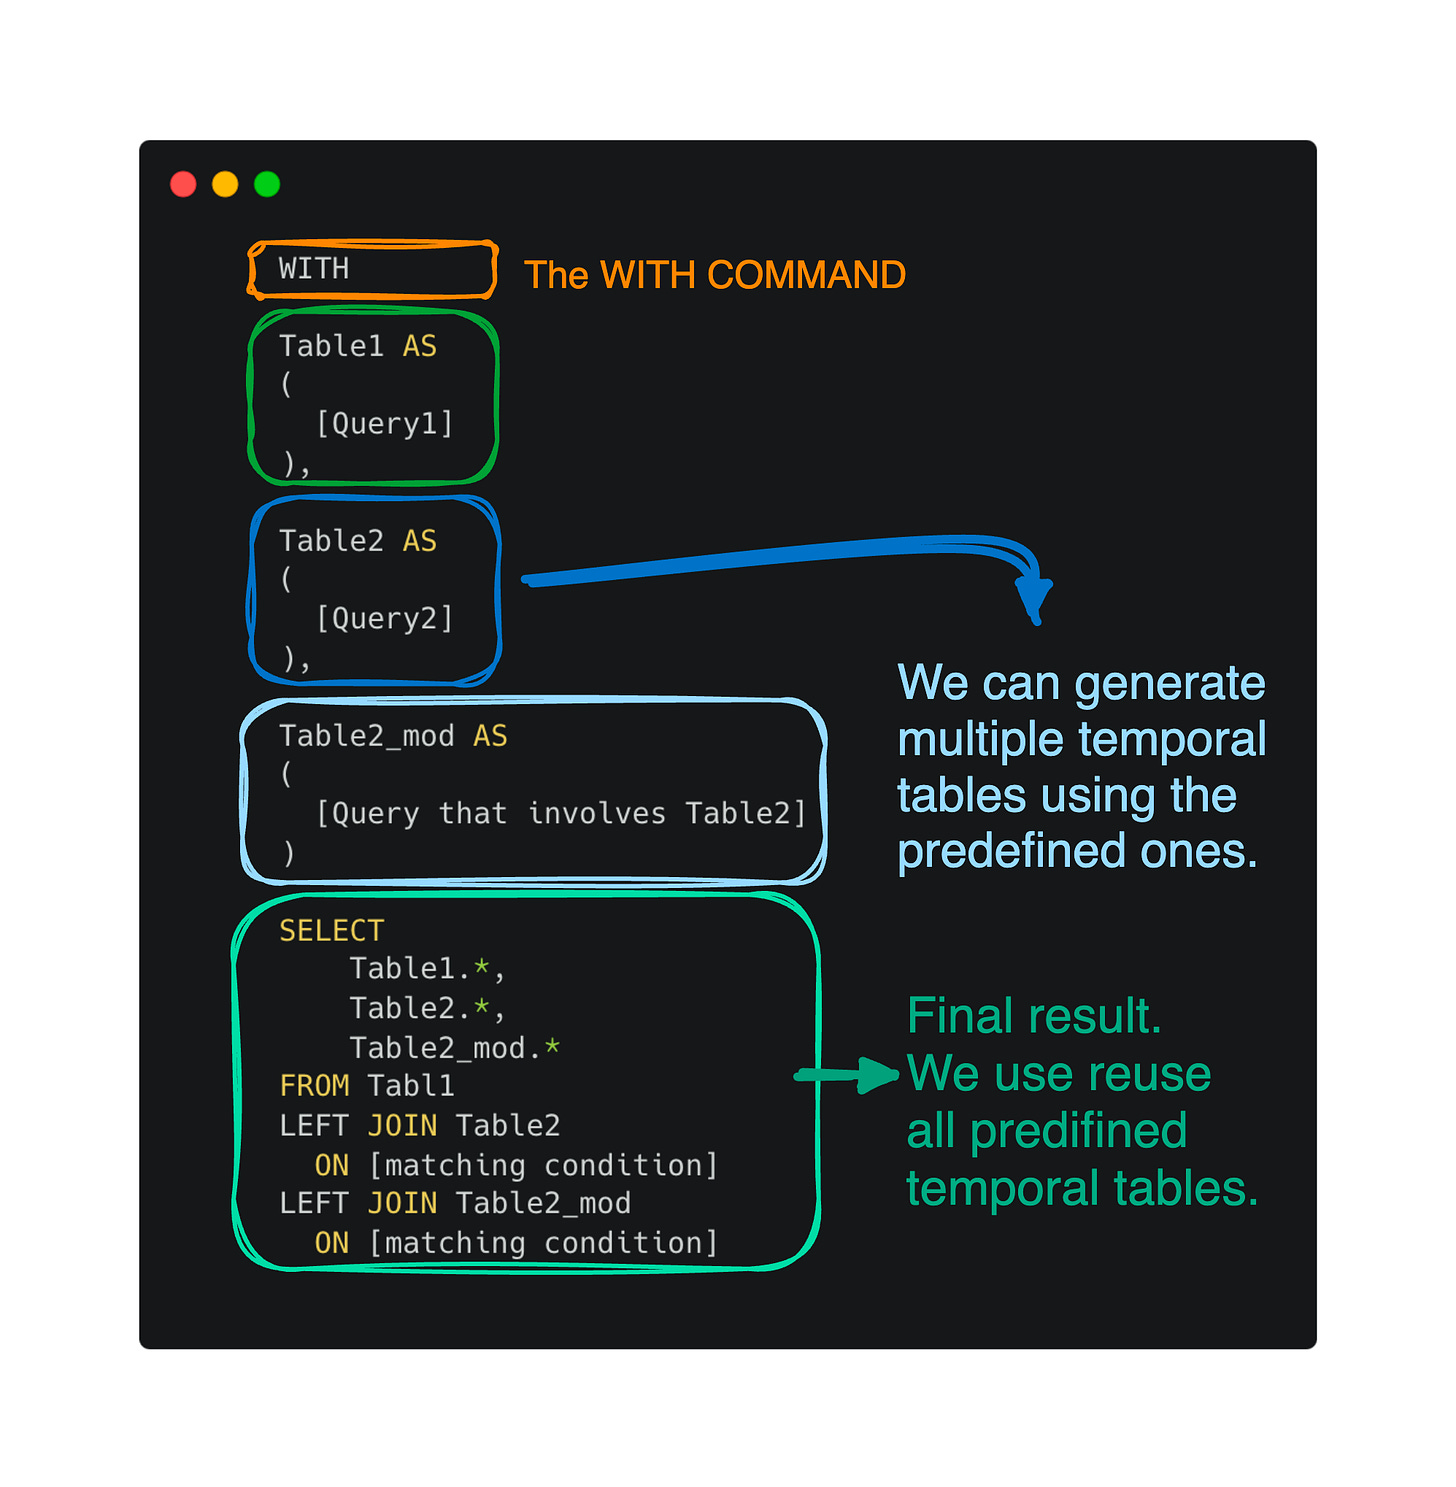
Then you better crush into Common Table Expressions (CTEs), the secret to modular SQL code!
Picture CTEs as temporary helpers standing by to organize your query's logic into neat, digestible sections. With the WITH clause, you can chain these helpers, each aliasing a subquery, to build complex queries without the clutter.
These modular queries allow you to create, reference, and manipulate multiple datasets on the fly.
Think of CTEs as LEGO blocks, snapping together to form the bigger picture—one that's intuitive, maintainable, and oh-so-slick.
You can go check the whole theory in the following article and you can find the cheat sheet in the following post.
#2. What’s happening on your computer?
Imagine Python as a vast library where every piece of data is a book, each with its unique story and shelf space.
In this library, the books—be it a crisp boolean or an elaborate data structure—are all objects with their own ID badges, neatly tucked into memory shelves.
These objects range from:
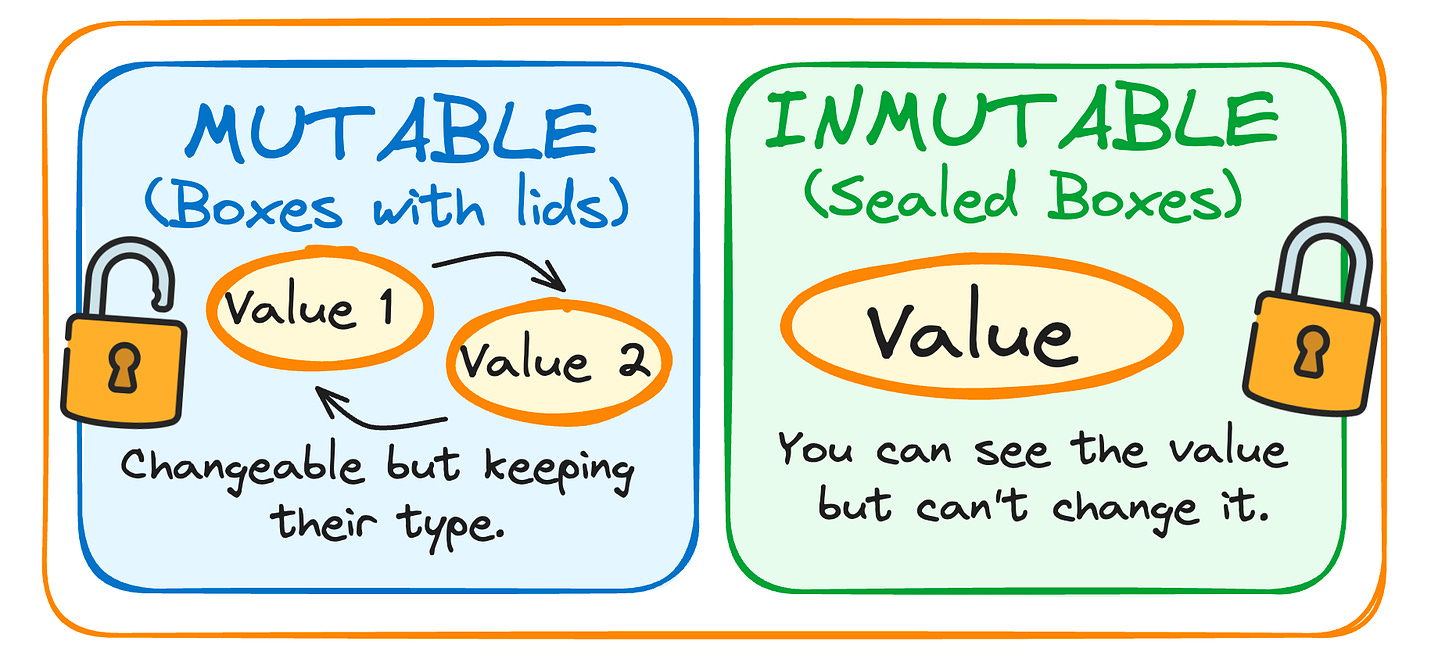
Mutable ones, like clay, ready to be reshaped - think of lists and dictionaries.
Immutable ones, like diamonds, unchanging - think of strings and integers
Dive into Python's universe, where variables are the trusty librarians, guiding you to the exact location of your data objects.
Remember, changing a variable is just a redirect, not rewriting the book!
And when you name your variables, you're not just slapping on labels, you're crafting a map that makes your code a treasure to read and a legacy to maintain.
So, name wisely—it's not just science, it's an art. 🎨🐍
You can get the whole cheat sheet in the following post.
#3. The Principle of Proportional Ink
Step right up to the vibrant world of Data Visualization, where 'ink' isn't just for pens—it's the essence of your story!
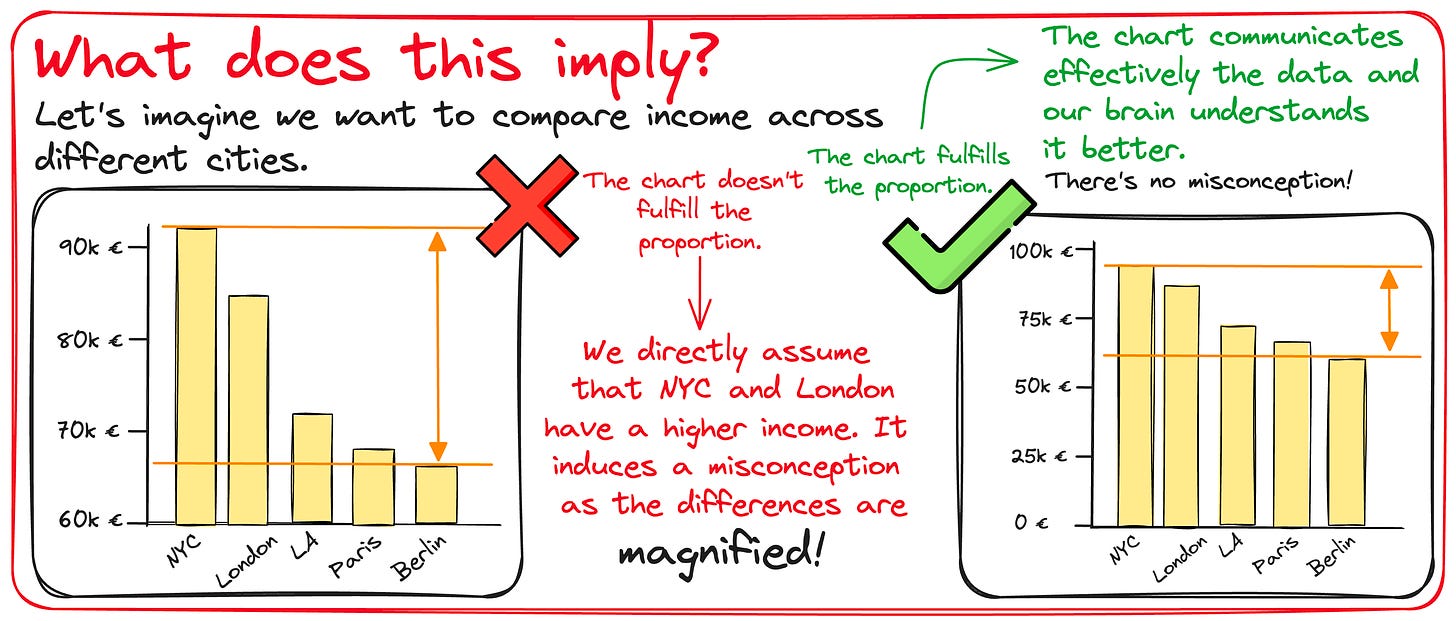
In DataViz, ink refers to any part of your chart that pops against the canvas of nothingness.
It's crucial because our brains are tricksters, assuming that more ink equals more importance.
Let's say you're comparing incomes across cities. If your chart's as exaggerated as a fisherman's tale, showing New York and London with towering bars, our brains might be duped into thinking the difference is as wide as the Atlantic.
The principle of proportional ink reminds us to keep it real—no optical illusions here.
The right amount of ink ensures a true-to-scale portrayal, keeping our data storytelling honest and our insights as clear as a sunny day! 📊✨
And this is all for now!
Thank you for subscribing to my newsletter.
If you have something you want me to write or discuss, please comment or directly message me through my social media!
Remember you can also find me in X, Threads, Medium and LinkedIn 🤓


