

CS1 - Understanding the Essentials of Time Series
Uncover Trends, Make Predictions, and Boost Your Analytics Skills

What Is a Time Series?
A time series is a special type of dataset:
It’s an ordered sequence of values collected at consistent time intervals.
Think of it as data with a built-in clock!
You’ll find time series data everywhere:
Stock prices, weather patterns, website traffic, and even your Spotify listening history.
Analyzing this kind of data helps us uncover trends, predict future behavior, and identify unexpected changes.
So let’s dive into Time Series!
Before starting, here you have the full-resolution cheatsheet 👇🏻
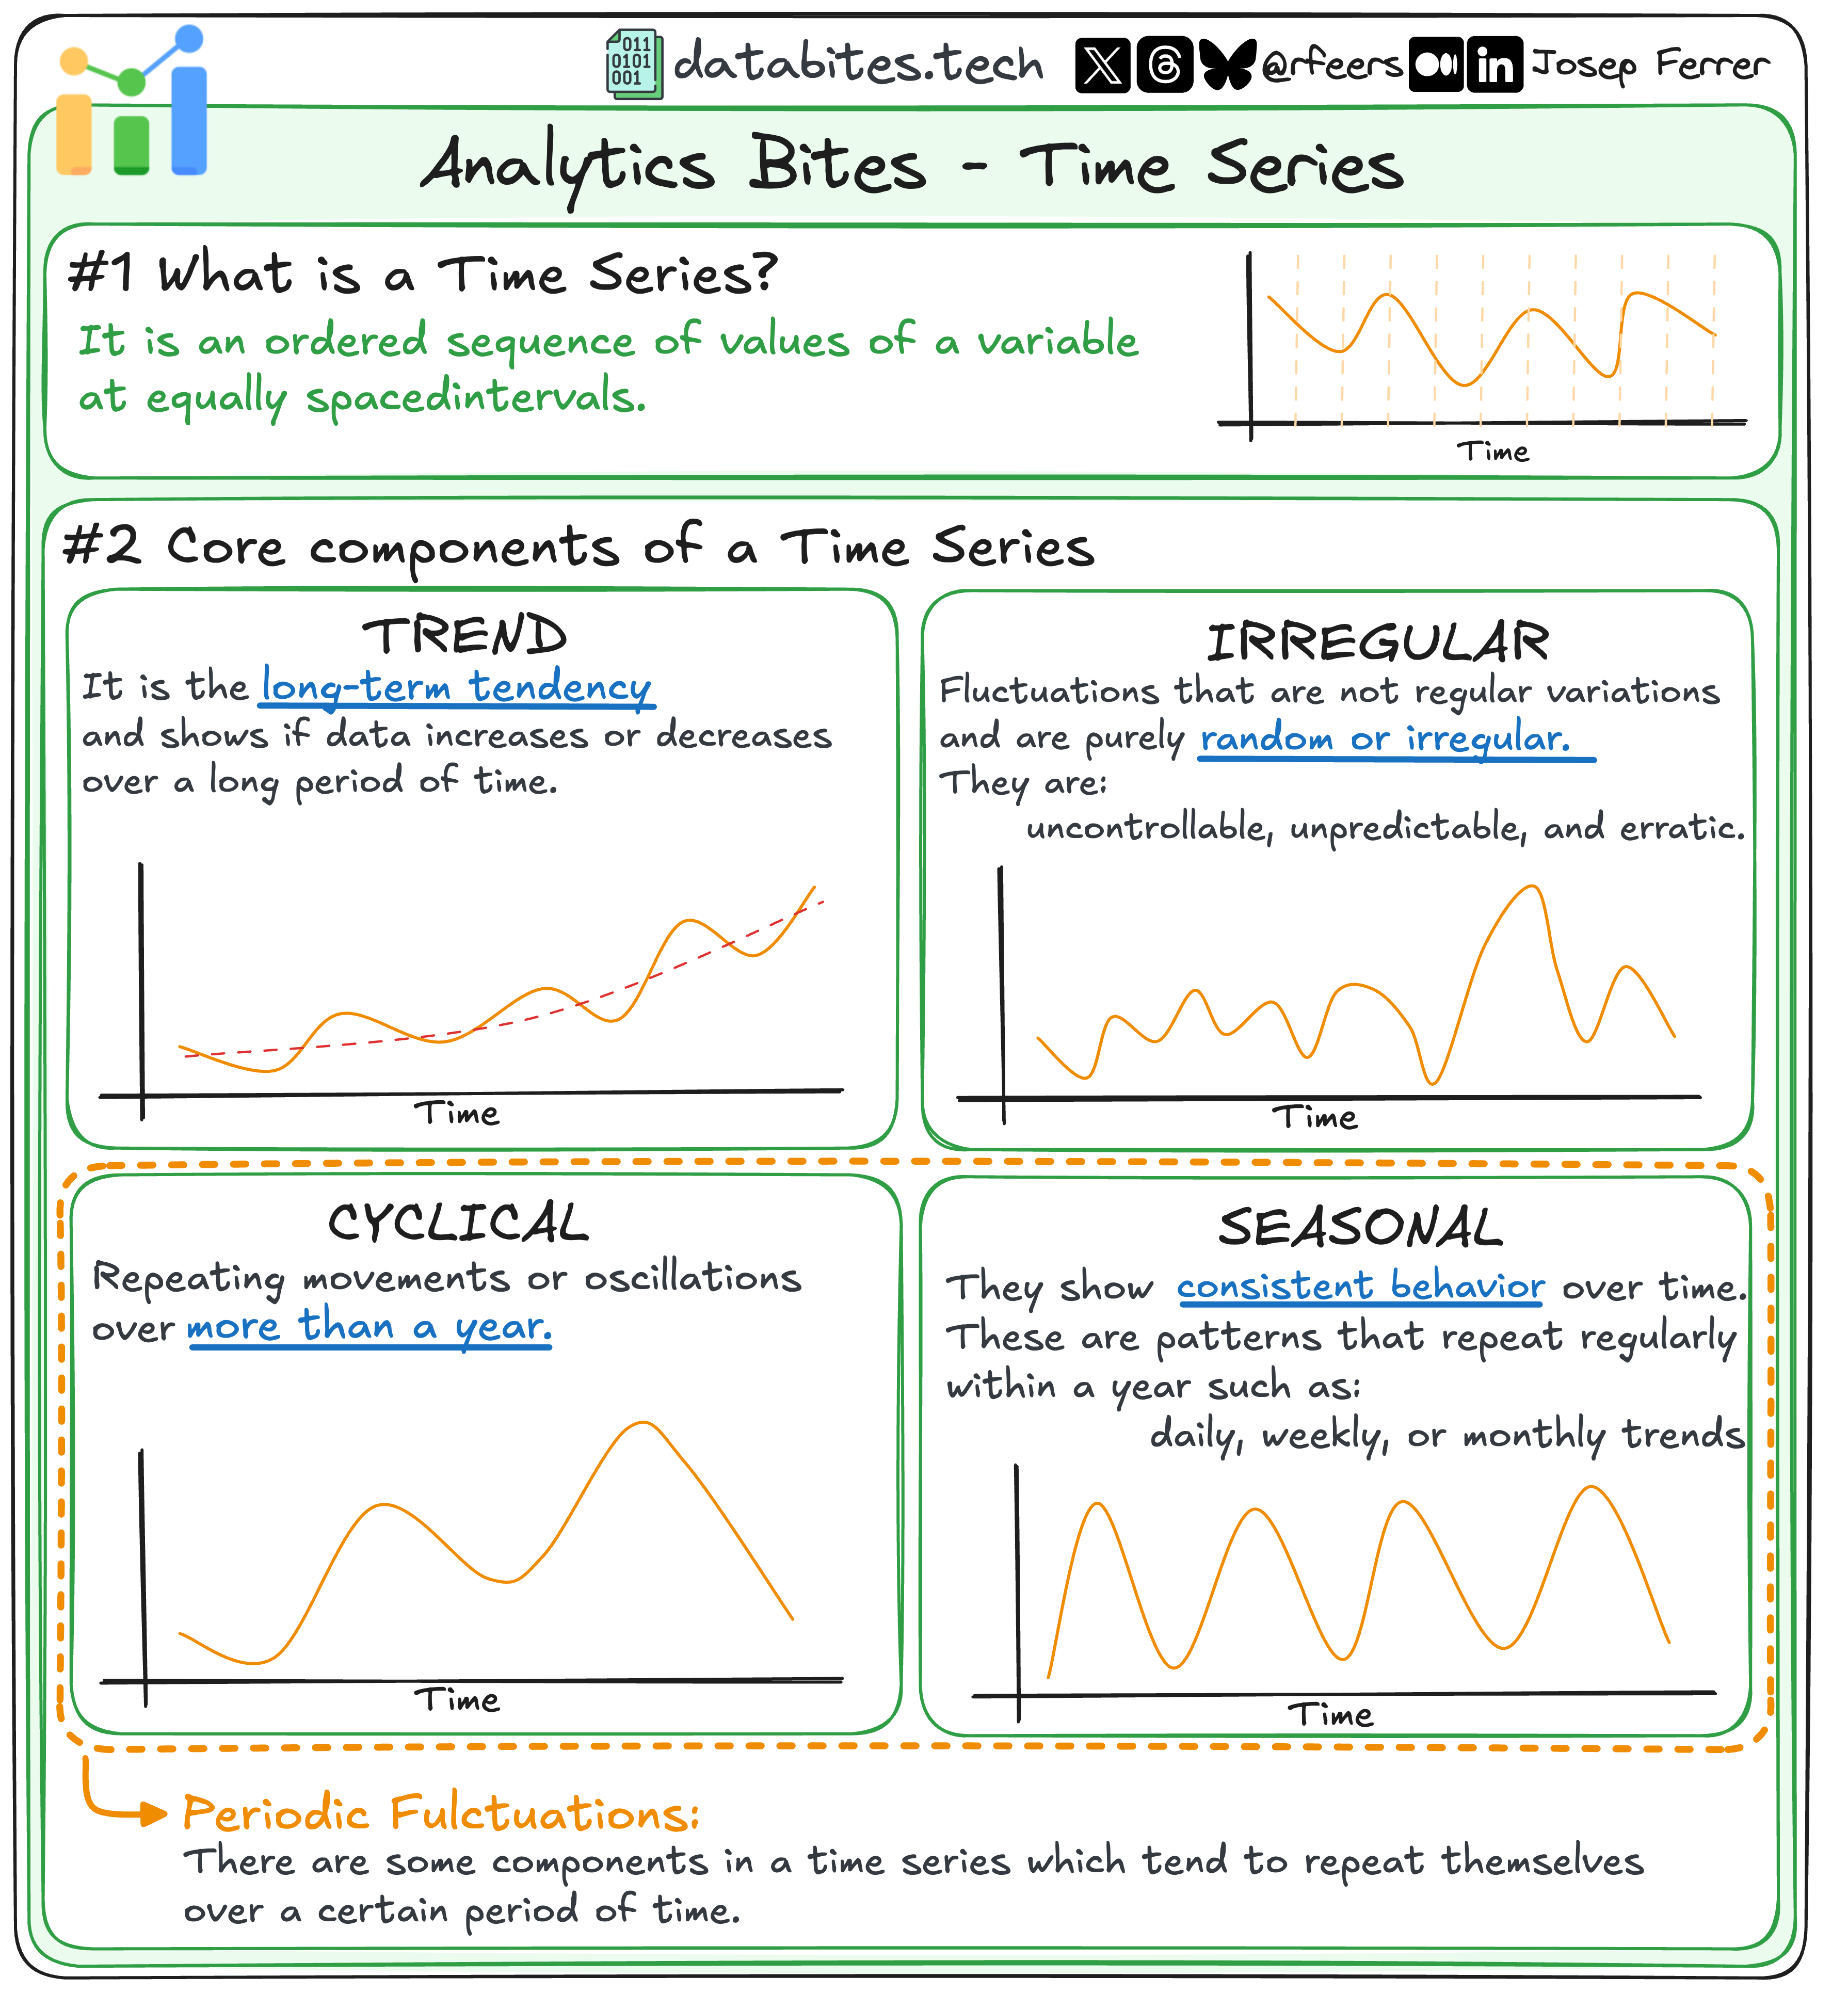
The Four Pillars of Time Series
1. Trend 📈
This is the long-term movement in the data. Does it rise, fall, or stay stable over time?
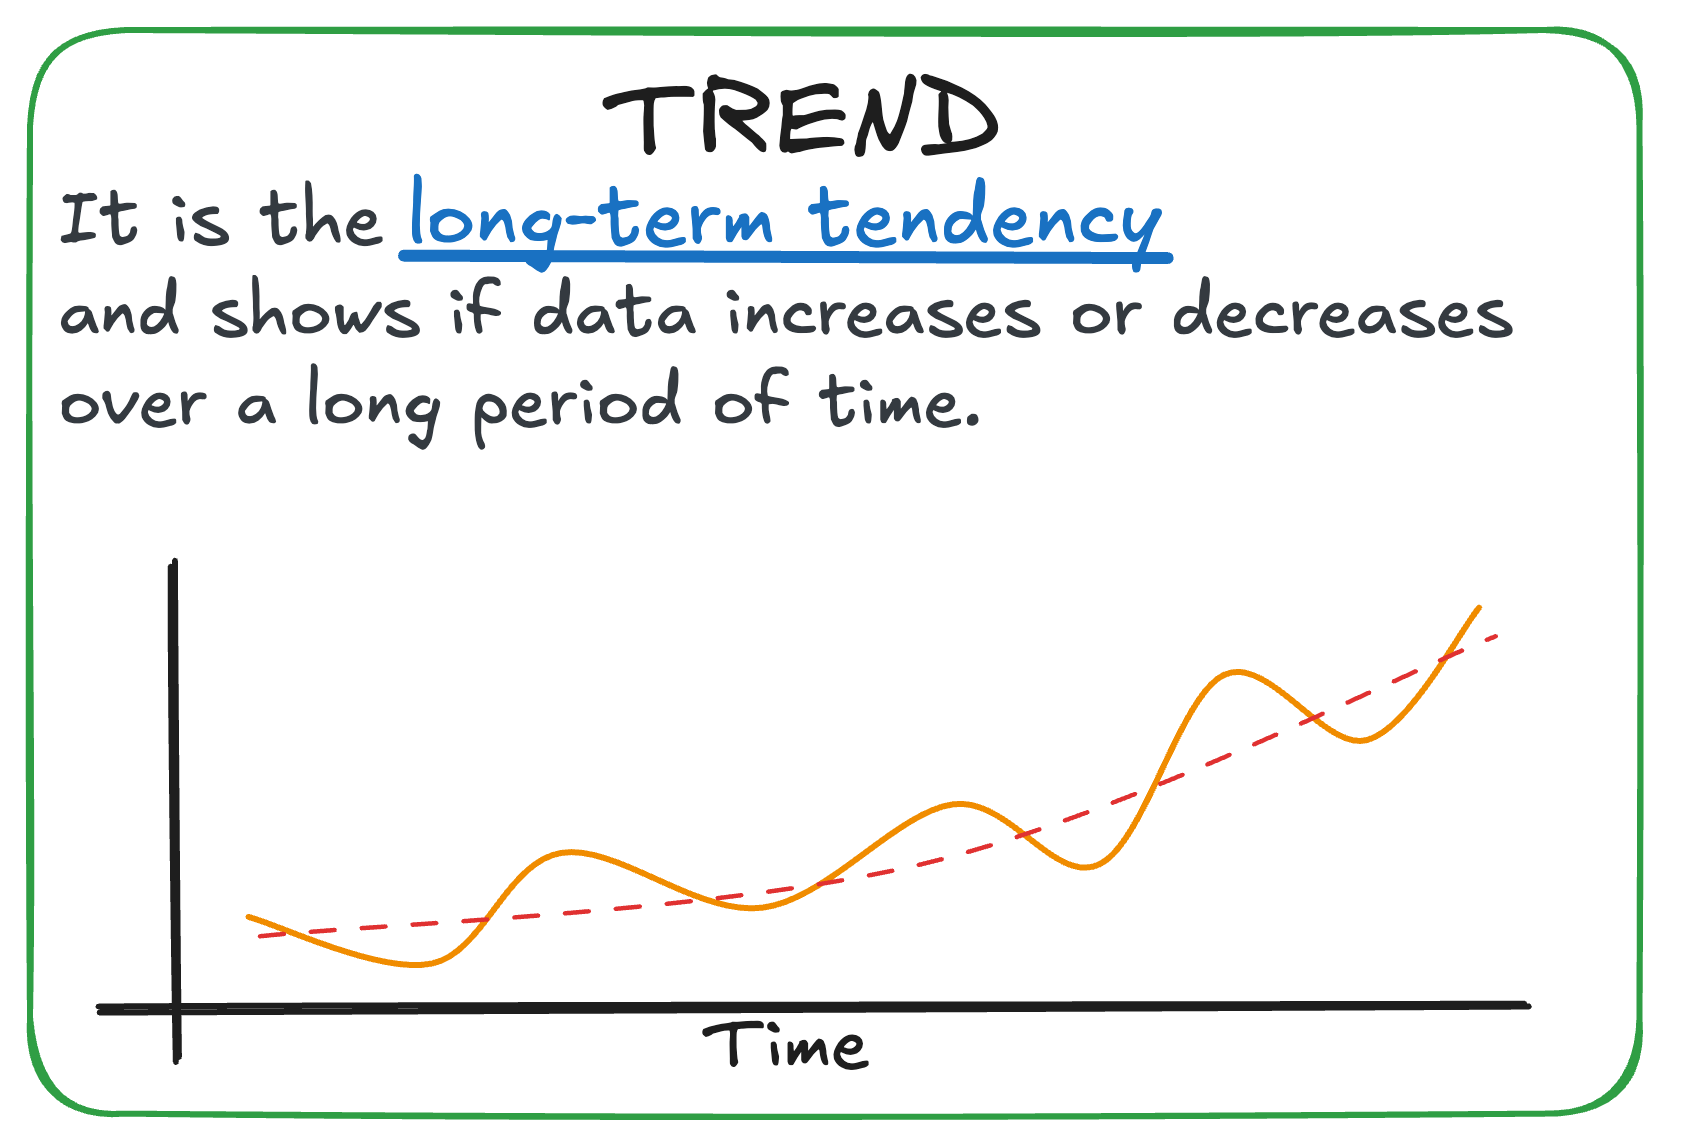
Example: A company’s annual revenue increasing steadily.
Pro Tip: Use tools like moving averages to isolate the trend from other components.
2. Seasonality 🌱
Seasonality captures recurring patterns that happen over a fixed period, like days, months, or years.
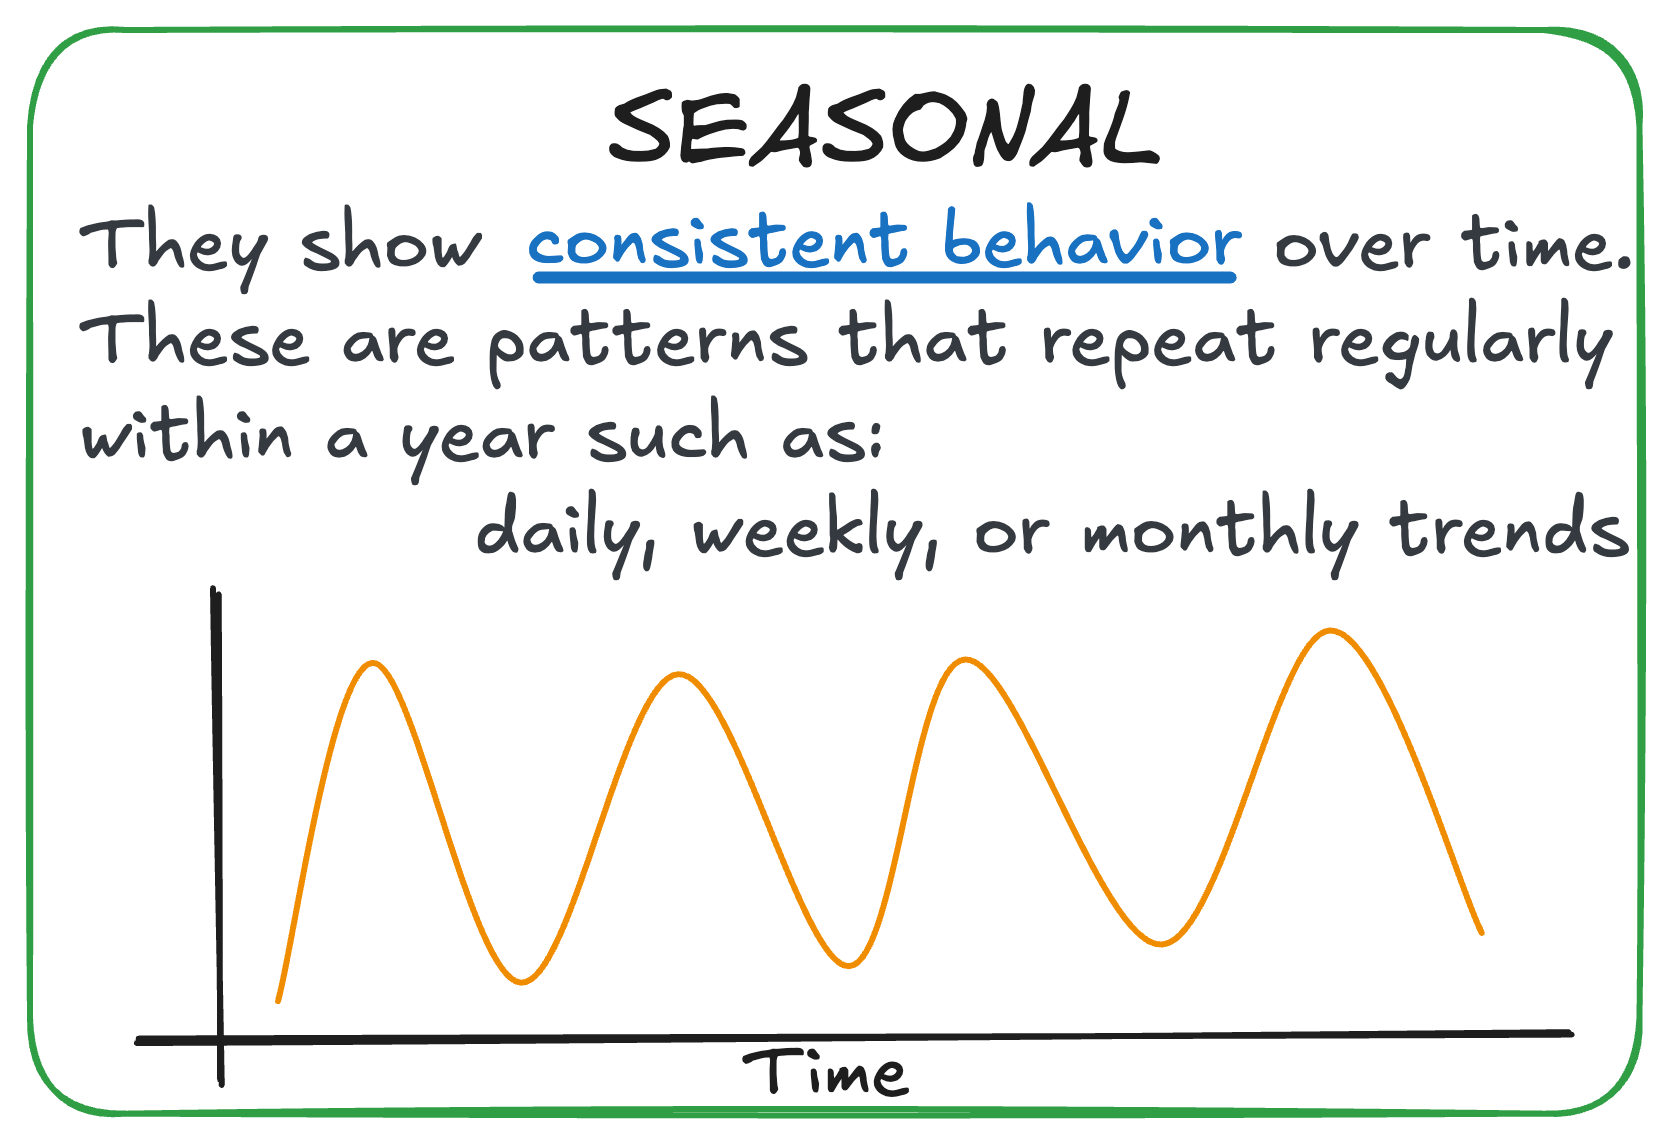
Example: E-commerce sales spiking every Black Friday.
Pro Tip: Seasonal decomposition (using libraries like
statsmodels) helps separate seasonal patterns from raw data.
3. Cyclical 🌀
Unlike seasonality, cyclical patterns occur over longer and irregular intervals, often tied to economic or environmental factors.
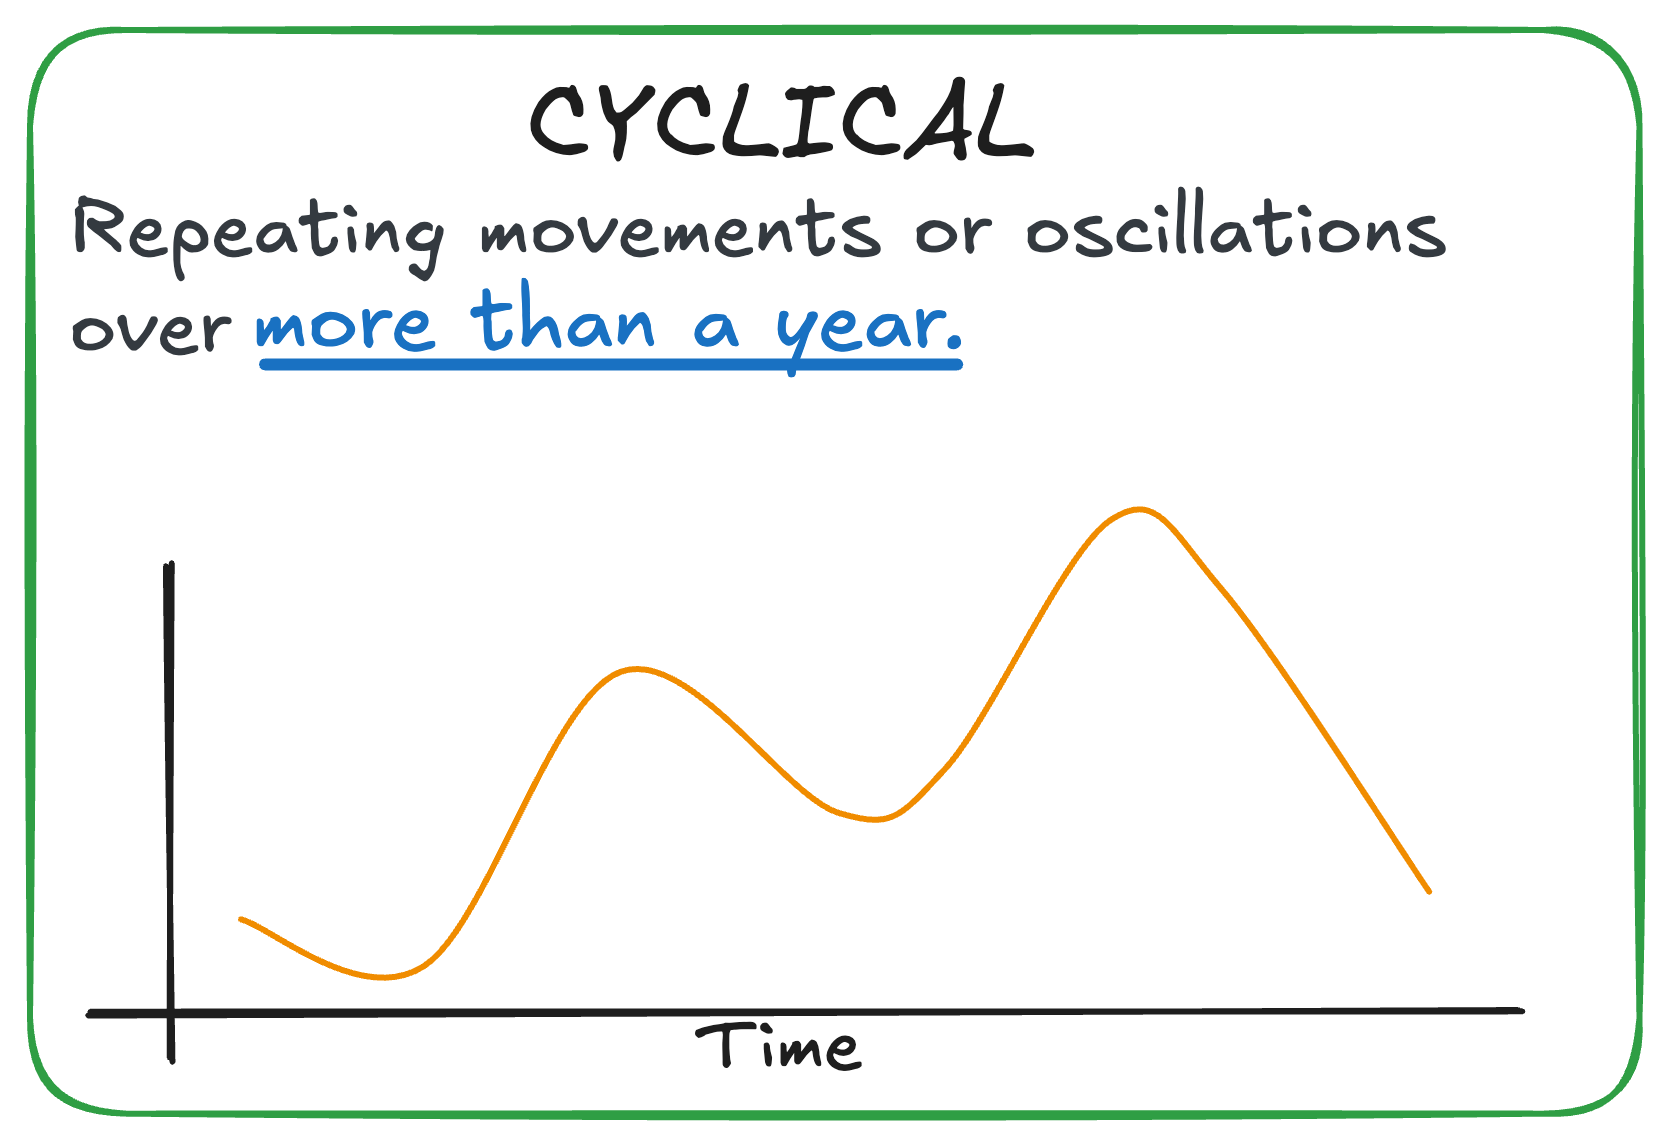
Example: Housing market cycles lasting several years.
Pro Tip: Cyclical behavior is harder to predict, so combine it with trend analysis for better forecasts.
4. Irregular 🤷♂️
These are the random, unpredictable fluctuations that don’t follow any pattern.
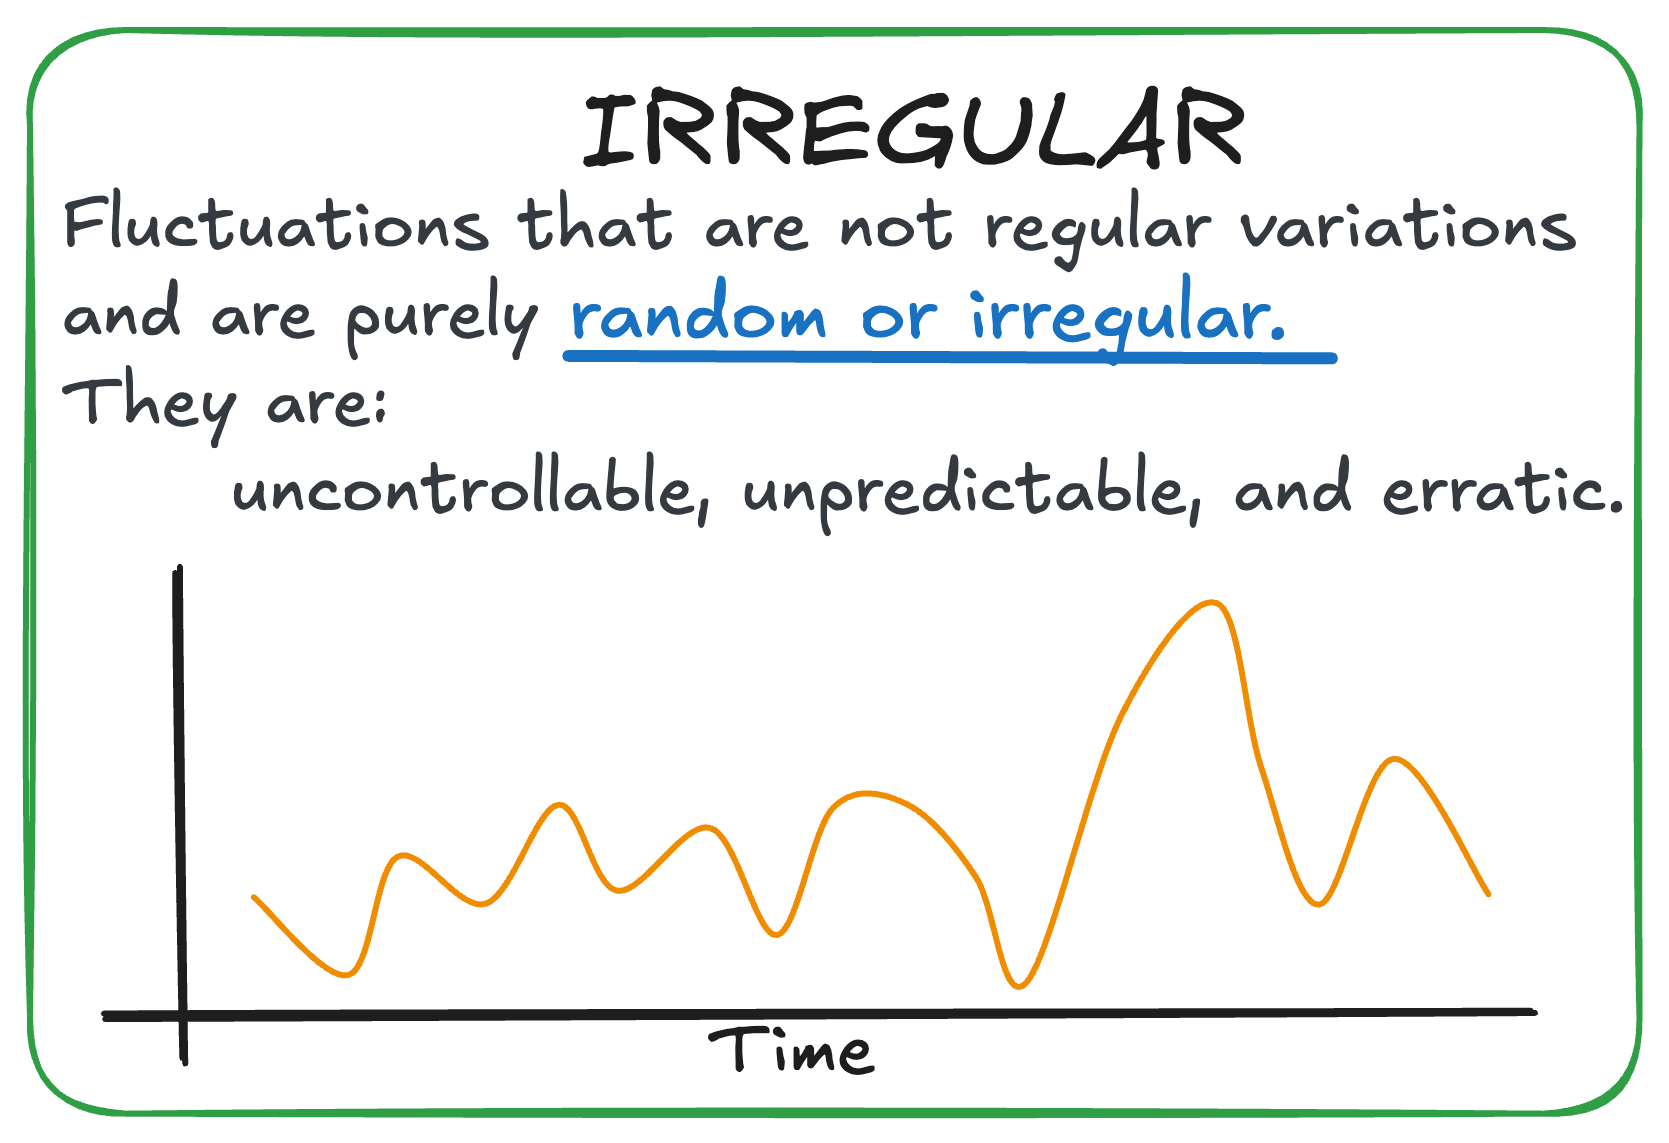
Example: A sudden sales spike after a celebrity endorsement.
Pro Tip: Use smoothing techniques to filter out noise for clearer insights.
Why You Should Care About Time Series Analysis
Time series analysis isn’t just a tool—it’s a superpower for making data-driven decisions. From forecasting future sales to detecting anomalies in IoT devices, time series opens doors to a whole new level of analytics.
Here’s where it shines:
Forecasting: Predict stock prices, weather, or customer demand.
Anomaly Detection: Spot unusual activity, like fraud or system failures.
Optimization: Understand patterns to schedule resources or improve workflows.
Ready to Dive In?
If you’re new to time series, don’t worry—I’ll be sharing a detailed beginner’s guide soon! In the meantime, here are a few tips to get you started:
Explore Your Data
Visualize it! Tools likeMatplotlibandSeabornmake it easy to spot trends and patterns.Decompose Your Series
Break it into trend, seasonality, and residuals using Python libraries likestatsmodels.Master Key Models
ARIMA/SARIMA for forecasting.
Prophet for handling missing data and seasonality.
LSTMs for complex patterns in deep learning.
And this is all for now! ✨
Before you go, tap the 💚 button at the bottom of this email to show your support—it really helps and means a lot!
Any doubt? Let’s start a conversation! 👇🏻
Want to get more of my content? 🙋🏻♂️
Reach me on:
LinkedIn, X (Twitter), or Threads to get daily posts about Data Science.
My Medium Blog to learn more about Data Science, Machine Learning, and AI.
Just email me at rfeers@gmail.com for any inquiries or to ask for help! 🤓
Remember now that DataBites has an official X (Twitter) account and LinkedIn page. Follow us there to stay updated and help spread the word! 🙌🏻